
Commodore’s Garage #21 – Telemetry
March 3rd, 2017 by Matt Holden
The most valuable thing to tuning a car is data. Whether it’s tire temperatures, pressures, wind tunnel, or telemetry data, anything that can tell you what the car is doing at any given moment can be worth its weight in gold. Despite a visual simplicity, telemetry data is a rabbit-hole of complexity with almost limitless possibilities that can tell you what you need to know, and even things you don’t really need to know (but are fun to talk about). Telemetry and data analysis is what I get asked about more than anything else, and many are surprised to find out how little we actually use it at Gale Force Racing across every series we may run. For some reason, there’s an idea that telemetry will tell you how to adjust the car which is far from the truth, but it’s extremely valuable for diagnosis purposes, not to mention its value when comparing drivers to each other.
For this article I will be using screenshots from MoTeC i2 Pro version 1.0.21. This is an older version, but it’s where my current workbook lives until I can get a new one built for the newer versions of MoTeC. Should you be a fan of the Atlas telemetry software, the same ideas and math will still apply, it might just look a little different.
The 2014 NASCAR PEAK Antifreeze Series Season

Indianapolis 2015 was where we finally managed to get over the mountain of issues that we’d built by solely using telemetry to build setups.
Before we dive off into the meat ‘n potatoes of telemetry, we need to take a look at where (and how) telemetry can get you in trouble. Telemetry is a method of data analysis and is simply a way to present a large variety of data from a race car at any given point or situation on the track. Therefore, telemetry is, by definition, a way for the car to communicate what it is doing on track to you or whoever is doing the setup work for your car. It is not, in any way, a way to show off issues with the car. During the 2014 season in the NASCAR PEAK Antifreeze Series, we fell into that trap with a few of our cars at Gale Force Racing. With the ride height rules removed from the garage, we focused heavily on telemetry and tire data to tune the cars, giving the drivers virtually no say in how the cars were built.
As you can probably imagine, this became a serious problem during the year. Instead of listening to the drivers (who are experiencing what the car is doing) we focused completely on telemetry to adjust the cars. This produced some extremely ill-handling cars and issues during the races where adjustments would produce no results or would produce the wrong result. Yes, Nick Ottinger won two races that year, but would you be surprised to learn that those races were the two races where telemetry was tossed and Nick built his own car off of feel? For 2015, we scrapped our “Telemetry-first” methods and while Nick still only won two races, the cars were much more consistent since we were adjusting based on what he was saying about the cars. In fact, everyone did better in 2015 in terms of on-track performance.
If we move a year further on from that to 2016, we have Alex Scribner’s Class B championship. Believe it or not, it was developed on a relatively low amount of telemetry analysis, with the vast majority of it coming in April during the spring break. For a given week, we would have two or three 1-hour practice sessions, and telemetry may have been running for 15 minutes total during the week. I don’t mean to say that telemetry should never be used, but it’s very easy to work yourself into a mountain of problems if you aren’t careful!
Know what you’re looking for
The most important thing about data analysis is to know what you’re looking for before you ever open up a log file. If you go into your data analysis program without any idea of what you need, it’s like trying to cook a meal without knowing what you’re going to cook. Whenever you’re building a brand new setup, you need to know ahead of time where you want the ride heights to be at speed, what your temperature spreads across the tires should roughly look like, and whether or not you will be seeing a lot of suspension oscillations (bumpy track) or if the suspension needs to be locked down (smooth track). Basically, whenever you build a brand-new setup, you’re going to be using telemetry to check and make sure you’ve gotten everything correct before you ever start adjusting on things.
For example, Alex used a brand new setup in the second half of the 2016 Class B season. The setup works so well for him that he still uses it today, three races into the 2017 season. His setup was built primarily off of the April test I mentioned earlier, during which Alex and I adjusted every single component on the car from a control setup and observed what happened to the car as a result. Once we knew what we needed about the car, we got the aero data he liked from our “older” setup and then built the new one with that in mind.
Ride height averages can be a fantastic tool to tune cars back to where they should be. Click for larger image!
Here’s an image from one of my most heavily-used telemetry channels: Height averages. Testing showed that each of our drivers liked a specific attitude for the car in terms of rake. Some like a very high rake, some like a very low rake, but it was always constant across all tracks. This box overlays both an average of the front ride heights and rear ride heights, giving a visual of the car’s rake angle which is crucial in terms of tuning the car’s drag-vs-downforce characteristics. You could further generate a rake angle by creating a difference channel (Rear AVG – Front Avg = Rake, inches) if you wanted to, but I use these two channels to make sure the aerodynamics are correct for me at a new track. If I make a spring change, it’s a simple case of double-checking these traces to make sure nothing has changed aerodynamically in the turns, which can mask the spring change. Once that’s checked, we’ll basically turn telemetry off and go from the garage temperatures alone.
Temperatures & Dampers
Tire temperatures can also be helpful in diagnosing handling issues. However, it’s important to note that the telemetry temperatures are recorded differently than the garage temperature readouts. Essentially, the garage temperature readouts are taken from the tire carcass in the same way you’d take the temperatures using a pyrometer in the real world. This device is simply a probe that sticks into the tire tread and records the temperature, and is very useful for getting an idea of how the tire has been loaded throughout a run. The telemetry readout, on the other hand, can be thought of as an infrared temperature sensor, getting the instantaneous temperature reading at any given moment on the tire. These figures will usually show a much more drastic change in temperature throughout a lap when compared to the garage temperatures, and can be used to identify a tire that is getting loaded too quickly which wouldn’t show up in the garage tire sheet.
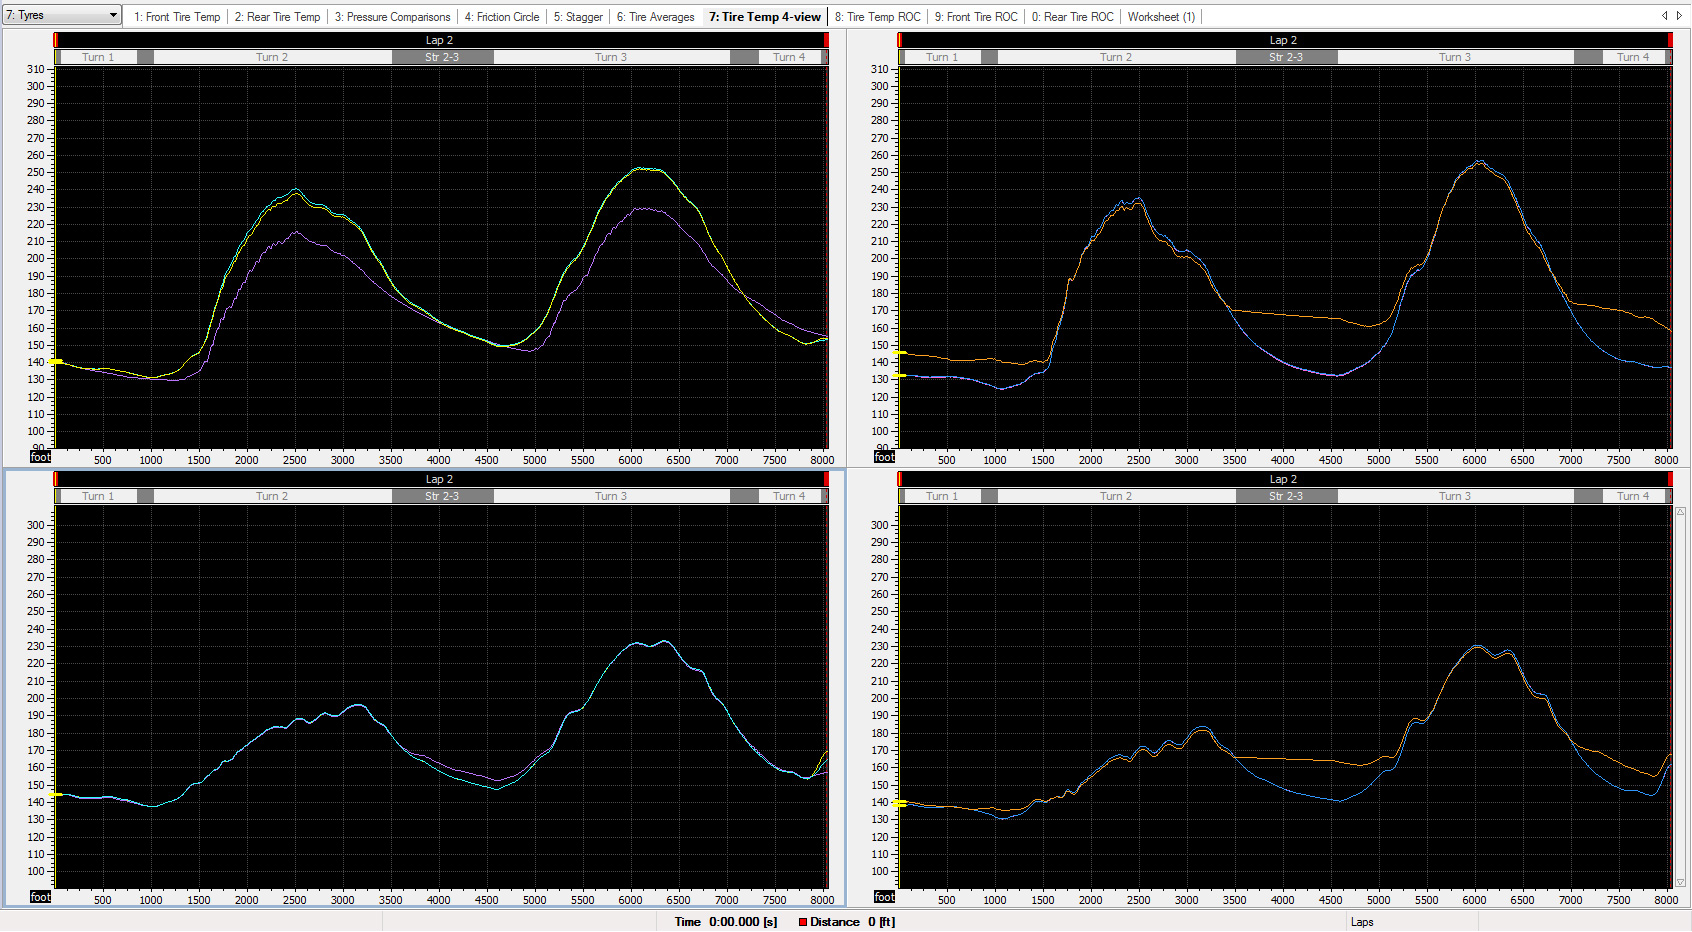
Organizing data to make it easier to interpret is helpful as well. Arranging tire temperatures as they would appear on the car can help to quickly confirm problems with the chassis. Here we can see an issue of the RR being overly cold in turns 1 and 2. Click for larger image!
Another channel to consider and pay attention to is the Damper Position (or Suspension Position) channels, as these can be directly tied to wheel movement in the car. If they aren’t moving, the wheels aren’t moving, usually a sign of either coil-binding or the suspension being very stiff at that given moment. Typically, a coil-bind trace will be flat while a stiff suspension trace will have movement around a given position. If this is what you’re going for, then it’s fantastic, but if not….well that’s a problem! Here are pictures of a coil-bind trace and a high-rate bumpstop damper trace:
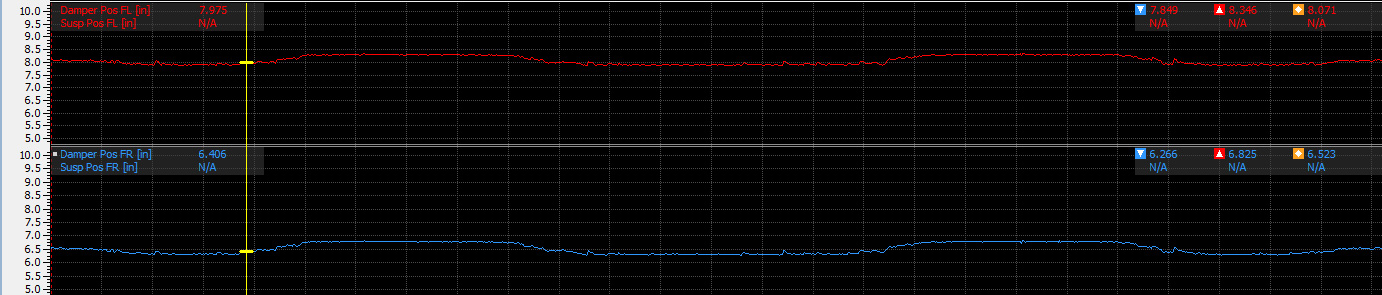
A typical coil-binding trace for front dampers. Note the flat sections of the trace where the spring is bound and suspension cannot move. Click for larger image!
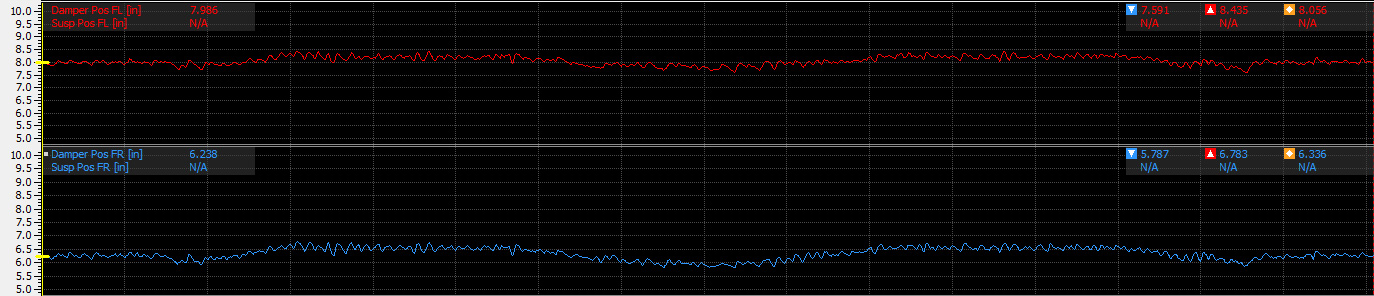
A high-rate bumpstop trace will look similar to a coil-bind trace, however will not feature the “flat-line” sections. Click for larger image!
Math Channels
Possibly the most powerful telemetry tool that is the most unknown feature is the Math channel. In many cases, engineers can only put so many sensors on a car before it becomes a problem, but a lot of information can be gathered from small amounts of data input. Enter: The math channel. In most telemetry programs, there is a feature that allows you to create your own mathematical formulas that generate a new channel that isn’t directly provided from the sensors given. The Ride Height Average channels mentioned before are math channels based on the following equations:
- Front Height AVG = (LF Ride Height + RF Ride Height)/2
- Rear Height AVG = (LR Ride Height + RR Ride Height)/2
Neither of these channels could be developed straight from any sensors, but with a simple mathematical entry we can get a new piece of data that is extremely helpful in tuning. My personal telemetry workbook has 47 unique math channels (Some are duplicates like the Averages), here are a few of the ones we use the most:
- Wheel Lockup: Wheel Speed RR + 20 < Wheel Speed RL
- This channel exists for all four wheels and compares a wheel with its opposite to determine a lockup. If the wheel speed of one wheel is 20mph lower than the other, data will output this as a “locked” wheel.
- Acceleration: derivative(Ground speed)
- A derivative is a calculus expression to determine the rate of change of a graph. The derivative of position is Speed (rate of change of position), and the derivative of Speed is Acceleration (rate of change of Speed). This simple channel can be used to find when an engine has “run out” of power on a long straight, or to help identify the best shift points on road courses. Not perfect, but it has proven its worth in the past.
- Single-side Pressure Differences: LF Pressure – LR pressure (Also for right-sides)
- When tuning, especially with springs, we want the pressures to stay fairly close front-to-rear to prevent the tire’s spring rate from influencing the car’s behavior. With this channel we can see when the pressures start to deviate and whether or not a driver’s behavior will play a role in producing these changes.
Driver Comparisions
The final thing we’ll look at is driver comparisons. If you have a new driver, there is nothing more valuable than knowing how that driver differs from the drivers you’re familiar with. We’ll look primarily and the driver’s inputs, usually the throttle and brake, overlaid with the car’s speed, to see any major differences.
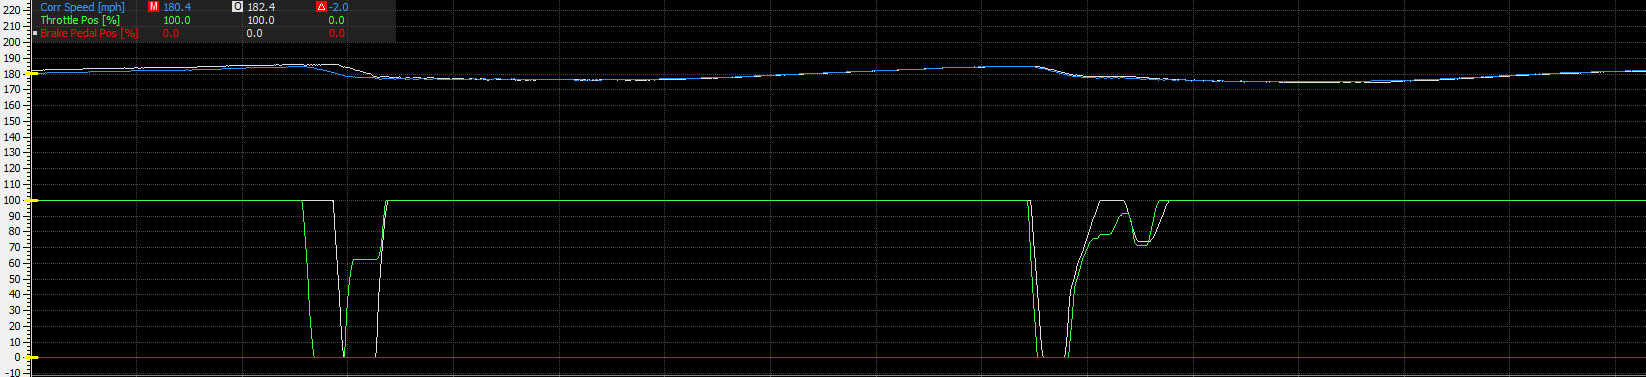
Input comparison between two drivers on the same setup on the same track. Click for larger image!
Here we can see two very different displays of drivers on the same track. For reference, the Color traces were slightly slower than the White traces. Most notable is the throttle behavior and how that influenced the car’s speed on track. The faster driver drove further into turn one and was back on the throttle very quickly, plus he didn’t hesitate on the throttle as the slower driver did. There’s a similar behavior at the other end of the track as well, with the faster driver being much more confident on throttle application. It should be worth noting that these two drivers were on the exact same setup.
Small things like the differences in throttle application and how far the faster driver went into the corner can lay an excellent foundation for setup changes for a newer driver. In this case, the color traces belonged to a newer driver, and his lower corner entry speed and much calmer throttle application allow him to run softer front springs due to the lower vertical loads on entry, as well as a much more forgiving car on corner exit due to smoother throttle application. The driver with the white traces needs a much stiffer car to cope with a more aggressive throttle application and corner entry behavior. With this information known, both drivers have cars that better suit their own driving styles, and speeds are similar between the two.
Final Thoughts
When we finish going over the necessary components to build a setup and we’ve begun the building process, telemetry will come into play. However, its use beyond initial build won’t be as extensive as some may expect. While it is invaluable through a testing process, it should never be used as a guide during the tuning stages, but instead as a way to confirm what you or the driver is saying about the car.
~~~~~~~~~~~~~~~~~~~~
To keep up to date with The Commodore’s Garage, return to Sim Racing News every Friday afternoon and “Like” our page at https://www.facebook.com/CommodoresGarage

You may also like...


OFFICIAL PARTNERS:


")

Customize Cookie Settings
Performance Cookies
These cookies gather data on how visitors use this website – which pages are visited most often, for example.
Functional Cookies
These cookies remember website preferences and generally improve the performance of the site for the user.
Marketing Cookies
These cookies are used to provide a customized experience and can be used to provide targeted ads through advertising networks.

Enhance Your Experience with Cookies
We use cookies to improve your site experience. Customize your cookie preferences below.
Copyright © 2024 iRacing.com Motorsport Simulations, LLC. All Rights Reserved.